Ѓy19•ЕЃz
Ѓ@
Tatsuhiko KAWASHIMAЃ–, Atsumi FUKATSUЃх and Noriyuki HIRAOKAЃц
Contents
Abstract
The
four major stages of the spatial-cycles are quantitatively examined, by use of
the Japan's population census data extending over the past sixty years (for the
period 1947-2005), for the Tokyo Metropolitan Area and its five major
railway-line regions. The
spatial-cycle hypothesis constructed by Klaassen and the method of the
Roxy-index analysis developed by the first author, are applied to our
investigation. The results obtained
clearly illuminate the recent trend of the re-urbanization of the population in
the
Keywords
Centralization,
Klaassen, Metropolitan Area, Re-urbanization, Revived Centralization
Roxy
Index, and Spatial Cycles
Ѓy20•ЕЃz
In this paper, the four
stages of the spatial cycles are quantitatively examined for (1) the Tokyo
Metropolitan Area‚PЃj as a whole and (2) its five major
railway-line regions. As analytical
tools for our study, Klaassen's spatial-cycle hypothesis and Kawashima's
ROXY-index method are applied, while our population data for the above-mentioned
six urban spatial systems cover the period of the nearly sixty years from 1947
through 2005.
In the following, the
basic scheme of Klaassen's spatial-cycle hypothesis is explained in Section 2,
and the primary characteristics of the ROXY-index method are illustrated in
Section 3. In Section 4, the
empirical analysis is carried out for the six urban spatial systems to gain a
better understanding of the spatial redistribution processes of the population
in large metropolitan areas. Some
research findings are shown in Section 5.
In the concluding remarks in Section 6, rough thoughts of the authors on
the mechanism of the urban transformation is given.
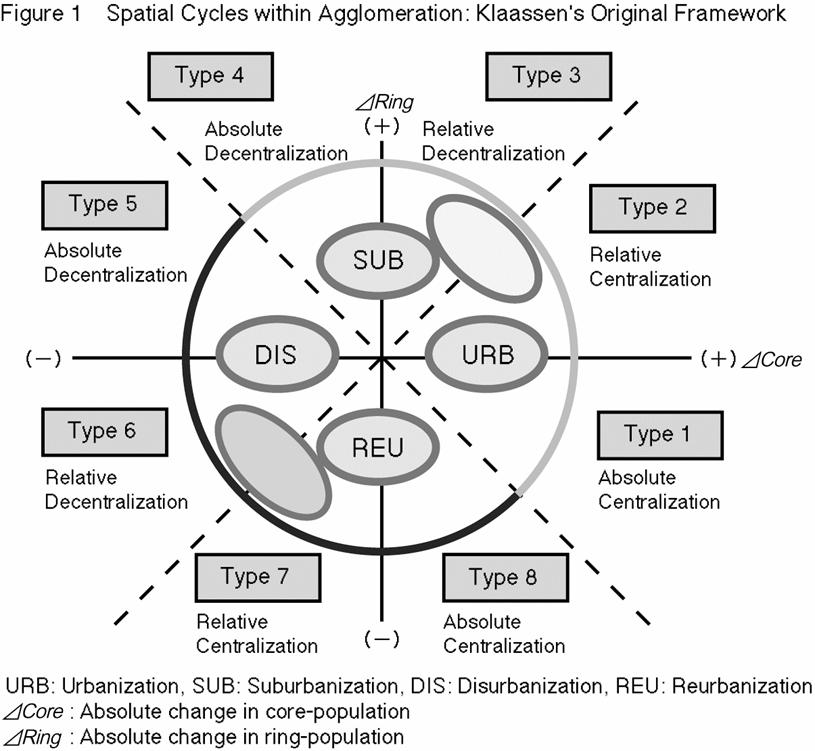
The original framework of
Klaassen's spatial-cycle paradigm‚QЃj for the
intra-metropolitan spatial systems (i.e. the spatial systems formed within
agglomeration) is described by Figure 1.
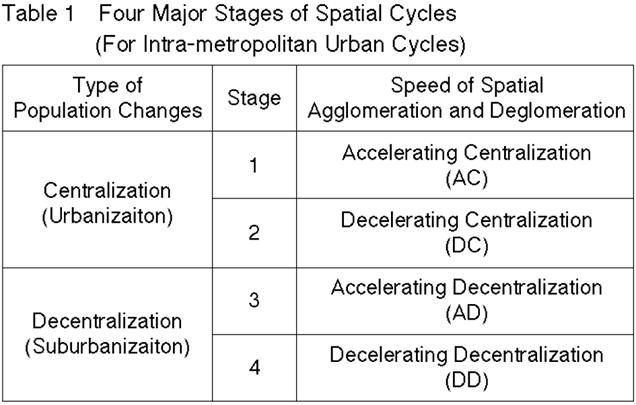
A revised version of this scheme argues the existence of the four major
recursively transmuting stages along the spatial-cycle path as shown by Table
1. The four major stages are:
‡@ accelerating centralization,
‡A decelerating
centralization,
‡B accelerating decentralization, and
‡C decelerating decentralization.
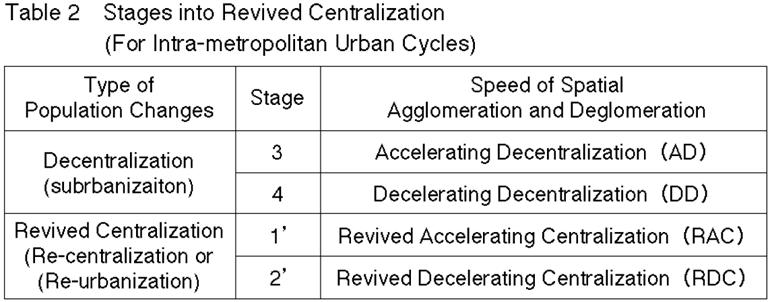
We use, in what is discussed below, the term Ѓerevived accelerating centralizationЃf (or,
simply Ѓere-centralizationЃf or Ѓere-urbanizationЃf) to
indicate the phenomenon of the re-entry of the spatial-cycle path into the
accelerating centralization stage from the decelerating decentralization stage
as shown by Table 2. In addition,
the terms of Ѓespatial cyclesЃf and Ѓeurban cyclesЃf are interchangeably used.
Ѓy21•ЕЃz
Ѓy22•ЕЃz
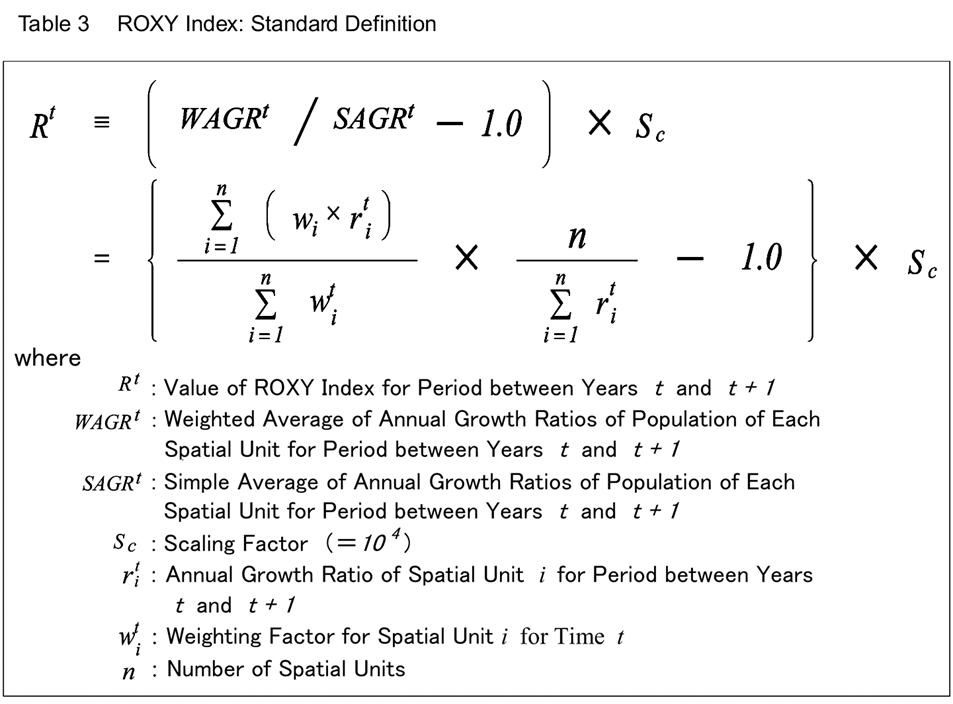
The ROXY index‚RЃj is an indicative instrument to quantitatively identify the major
stages of the spatial cycles. This
index can be used in conducting both of the intra-metropolitan analysis and inter-metropolitan
analysis to study the spatial agglomeration and deglomeration processes.
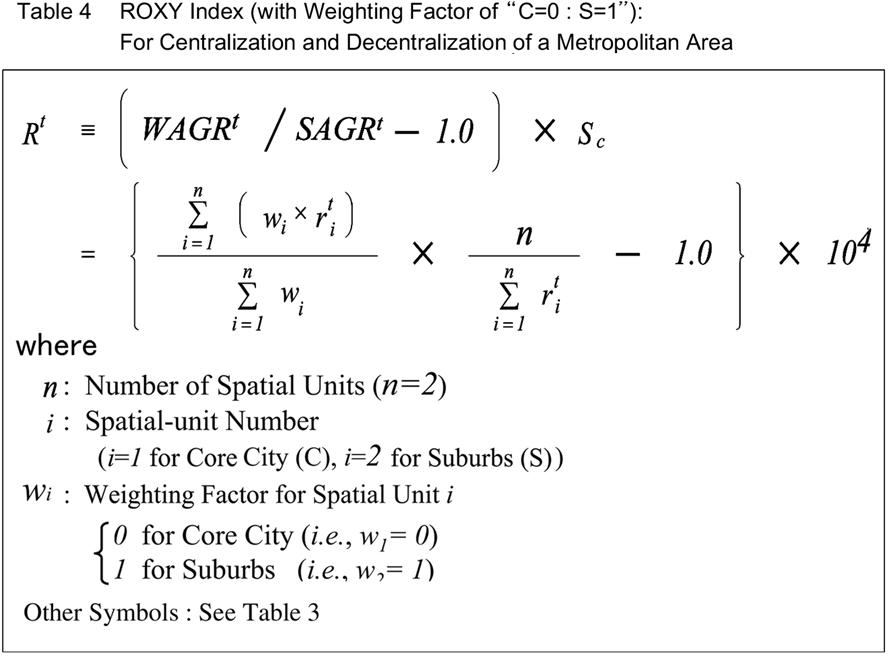
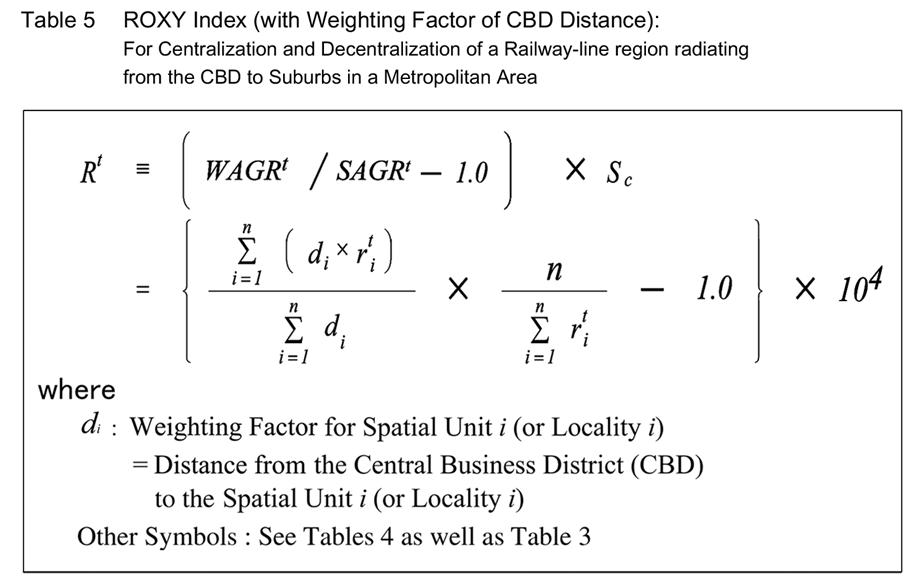
The standard mathematical
formulation to define the ROXY index is given by Table 3. We apply to our study the two variations
of this standard definition. One is
for the case in which we set the weighting factor of Ѓgcore-city = 0, suburbs = 1Ѓh as shown by Table 4,
while the other is, as shown by Table 5, for the case in which we set the
weighting factor of
Ѓgthe CBD distanceЃh for each of the spatial units which constitute a specific urban
spatial system‚SЃj under investigation. The former weighting factor is used in
the spatial-cycle analysis for the Tokyo Metropolitan Area as a whole, while
the latter is used for each of the five major railway-line regions in that metropolitan
area.
Ѓy23•ЕЃz
Ѓy24•ЕЃz
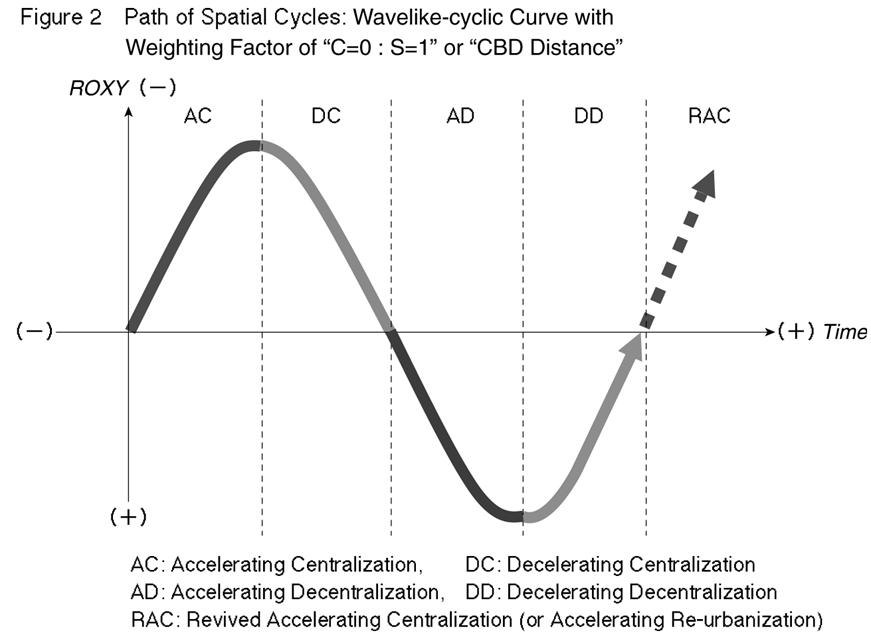
Based on
Tables 4 and 5, we can draw Figure 2 which displays Klaassen's spatial-cyclic
path in the form of a wavelike-cyclic curve. It should be noted that the abscissa and
ordinate indicate the time and ROXY-index value (ROXY) respectively, and that
the upper part of the ordinate carries the negative sign. As can be seen from Figure 2, the value
of the ROXY index turns out to be:
(1)
negative and decreasing, for the stage of accelerating centralization (AC),
(2) negative
and increasing, for the stage of decelerating centralization (DC),
(3)
positive and increasing, for the stage of accelerating decentralization (AD),
(4)
positive and decreasing, for the stage of decelerating decentralization (DD),
(5)
negative and decreasing, for the stage of revived accelerating centralization
(RAC), and
(6) zero
(more appropriately, at or in the vicinity of the value zero), for the stage at
which the spatial redistribution process is neutral‚SЃj.
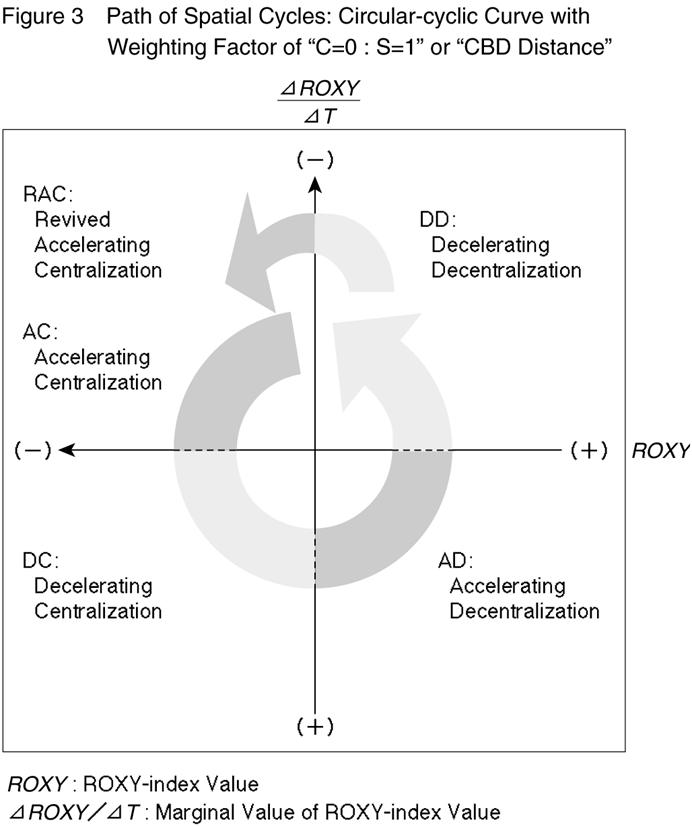
On the other hand, also from Tables 4 and 5,
we can draw Figure 3 which displays the spatial-cyclic path in the form of a
circular-cyclic curve. In this
figure, the abscissa and ordinate respectively indicate the ROXY-index value
(ROXY) and the marginal value of the ROXY index with respect to time (ѓўROXY/ѓўT). It should be noted for the graph in
Figure 3 that the upper part of the ordinate carries the negative sign so that
the circular-cyclic curve can move in an anticlockwise direction as practiced
in Klaassen's original framework shown by Figure 1.
Ѓy25•ЕЃz
4-1
Data and Setting
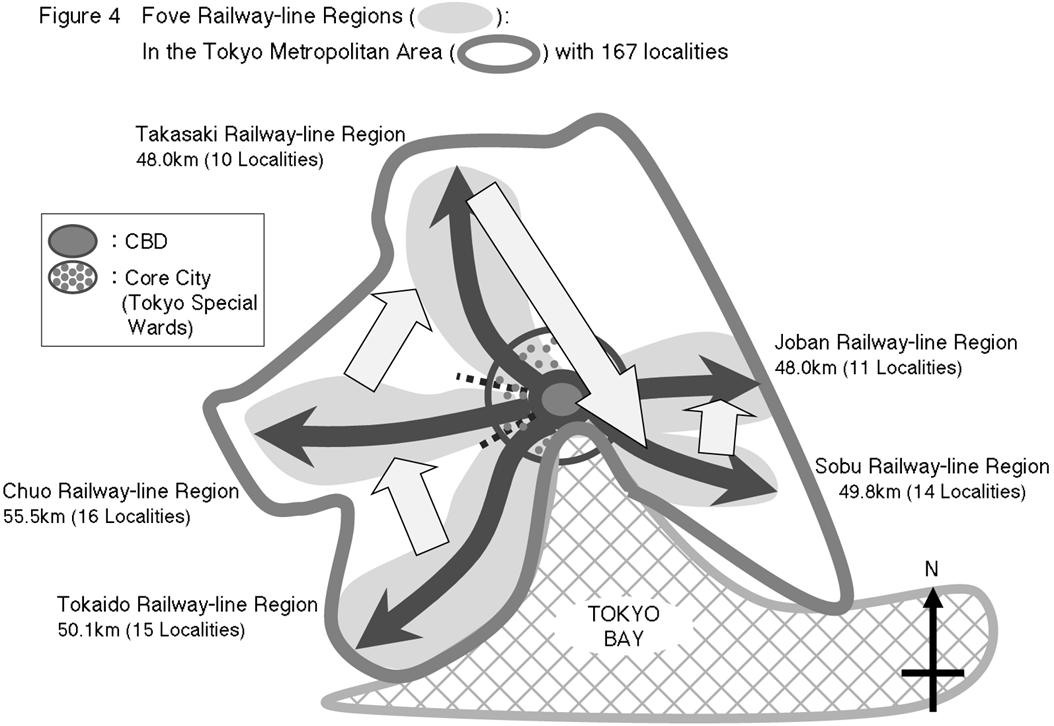
For our study, we use the
Japan's population census data extending over the past sixty years for the
period 1947-2005 (with 13 census-year points), for the Tokyo Metropolitan Area
and its five major railway-line regions (i.e., Tokaido, Chuo, Takasaki, Joban
and Sobu railway-line regions) as shown by Tables A1, A5, A9, A13, A17 and
A21. Figure 4 shows the
geographical configuration of the six urban spatial systems together with the
information on (1) the number of member localities constituting each of the six
spatial systems that are the Tokyo Metropolitan Area and the Tokaido, Chuo,
Ѓy26•ЕЃz
4-2
Results
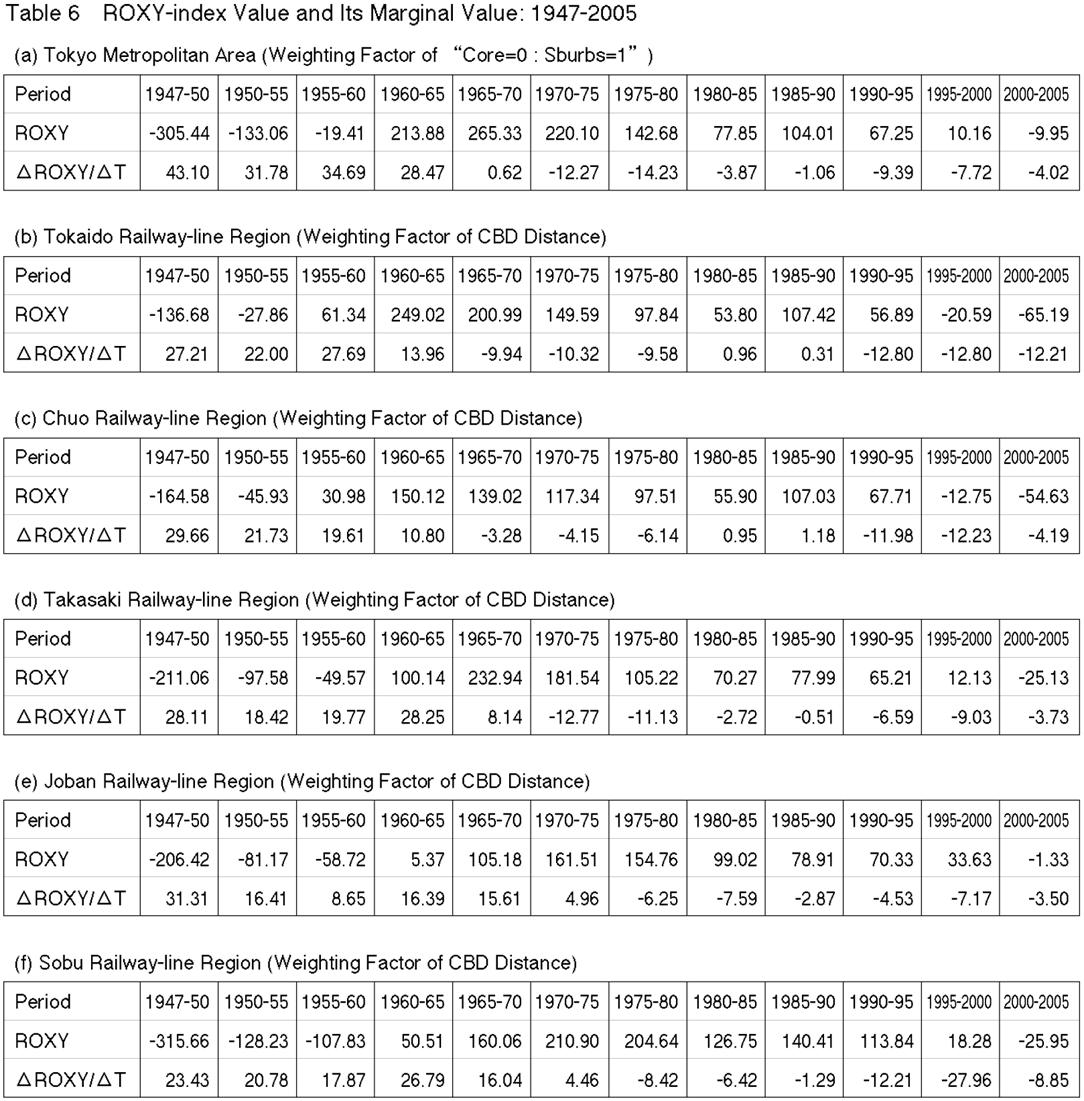
For the six urban spatial
systems, we calculate the ROXY-index values by going through those steps shown
by Tables A2〜A4 for the Tokyo Metropolitan Area, A6〜A8 for the Tokaido railway-line region, A10〜A12 for the Chuo railway-line region, A14〜A16 for the Takasaki railway-line region, A18〜A20 for the Joban railway-line region, A22〜A24 for the Sobu railway-line region.‚TЃj The
obtained ROXY-index values are shown by Table 6. Based on this table, we can draw the
wavelike-cyclic curves and circular-cyclic curves of the spatial-cycle path for
each of the six urban spatial systems as shown by Figures 5〜16.
Ѓy28•ЕЃz


Ѓy29•ЕЃz


Ѓy30•ЕЃz

Ѓy31•ЕЃz


Ѓy32•ЕЃz


Ѓy33•ЕЃz

Ѓy34•ЕЃz
The following are among
the primary findings from our analysis.
(1) Re-centralization
(i.e., re-urbanization)
The first arrival of the
re-centralization stage‚UЃj of spatial cycles for the Tokyo Metropolitan
Area in the postwar 60 years, after passing through the stages of decelerating
centralization, accelerating decentralization and decelerating
decentralization. This phenomenon
would suggest that the core-area part of the Tokyo Metropolitan Area will
significantly increase its important role in the future urban policies of
(2) Periodic length of 80〜100 years
There would possibly
exist the urban spatial cycles with the estimated period of 80〜100 years as to the spatial redistribution processes of the
population in the Tokyo Metropolitan Area.
(3) Clockwise spatial
urban development
Rough tendency of the
clockwise rotation in the Ѓgspatial urban developmentЃh is observed over the five major railway-line regions each of which
radiates from the CBD of the Tokyo Metropolitan Area to its suburbs.‚VЃj
Having conducted our
analysis, we are now eager to detect the causal relationships, by assuming
their existence nearly without doubt, that would substantially govern the
spatial cycle processes. This kind
of feedback from the obtained outcomes of the empirical analysis to the
construction of a new causality paradigm, should certainly be encouraged. I would not want to discount to any
degree the tremendous importance of this kind of scientific attitude through
which we try to find the
Ѓgexternal explaining variablesЃh controlling the path of spatial cycles. However, at the same time, we wonder
whether there are not a few phenomena for which we can not successfully
discover any suitable external explaining variables, perhaps because there are
no such external relations existing.
As for those phenomena, some insight might be gained that it would
perhaps be appropriate for us to tackle such phenomena by suspecting the
possible existence of a self-embedded mechanism within the phenomena that are
administered by various sorts of internal urban genes which we can not easily
manipulate externally. This
approach might sometimes contribute to open our minds to grasp the
so-far-well-hidden but critical factors of such phenomena. The more we have investigated the
spatial cycle movements through the ROXY-index approach, the more we have
become inclined to sense that the urban entity itself may have its own built-in
urban genes to direct the urban dynamism, or its own internal self-organized
mechanism to dictate the basic fate of spatial agglomeration and deglomeration
transformation.
Ѓy35•ЕЃz
Fukatsu
A., and T. Kawashima, 1999, ЃgUrbanization, Suburbanization and
Revived-urbanization: ROXY-index Analysis for the Chuo-line Region of Tokyo,Ѓh Gakushuin Economic Papers (Gakushuin Daigaku
Keizai Ronshuh), Vol.36, No.3,
Glickman
N., 1979, The Growth and Management of the Japanese Urban System, Academic
Hirvonen
M., N. Hiraoka and T. Kawashima, 1999, ЃgLong-term Urban Development of the
Finnish Population: Application of the ROXY-index Analytical Method,Ѓh Gakushuin Economic Papers (Gakushuin Daigaku
Keizai Ronshuh), Vol.36, No.2,
Klaassen
L. H., and J. H. Paelinck, 1979, ЃgThe Future of Large Towns,Ѓh Environment and Planning A, Vol.11,
No.11, pp.1095-1104.
Klaassen
L. H., J. A. Bourdrez and J.Volmuller, 1981, Transport and Reurbanization, Gower Publishing Company Limited,
Kawashima
T., 1978, ЃgRecent Urban Evolution Processes in Japan: Analysis of Functional
Urban Regions,Ѓh presented at the Twenty-fifth North American Meetings of the
Regional Science Association, Chicago, Illinois, USA, 1978.
Kawashima
T., 1981, ЃgUrbanization and Metropolitan Analysis,Ѓh Shin-toshi, Toshi Kyohkai,
Kawashima
T., 1982, ЃgRecent Urban Trends in Japan: Analysis of Functional Urban Regions,Ѓh
Human Settelement System: Spatial
Patterns and Trends, T. Kawashima and P. Korcelli (eds.), International Institute for Applied Systems Analysis,
Laxenburg, Austria.
Kawashima
T., and N. Hiraoka, 1993, ЃgMathematical Characteristics of ROXY Index (I):
Distance and Reversed Distance Used as Weighing Factors,Ѓh Gakushuin Economic Papers (Gakushuin Daigaku Keizai Ronshu),
Vol.30, No.2,
Kawashima
T., and N. Hiraoka, 1995, ЃgROXY-index Analysis on the Spatial-cycle Path for
Six Spatial Systems in
Kawashima
T., and N. Hiraoka, 2001, ЃgROXY Index Analysis of Spatial Cycles for Population
Changes in
Mitsubishi
Research Institute, 1999, Toshikenbetsu
Jinkou Suikei Chosa (Population Projections by Functional Urban Region),
Ѓy36•ЕЃz

Ѓy37•ЕЃz

Ѓy38•ЕЃz

Ѓy39•ЕЃz

Ѓy40•ЕЃz

Ѓy41•ЕЃz

Ѓy42•ЕЃz

Ѓy43•ЕЃz
Ѓy44•ЕЃz

Ѓy45•ЕЃz

Ѓy46•ЕЃz
