【181頁】
Increasing National Pension Premium Defaulters and Dropouts in Japan
Wataru Suzuki
Gakushuin University, Tokyo, Japan
Yanfei Zhou
Japan Institute for Labour Policy and Training, Tokyo, Japan
Abstract
This paper investigates why so many people are premium payment defaulters or dropouts from the national pension system using household-level data from a Japanese Government Survey. The major results can be summarized as follows: (1) the dropout probability of younger cohorts does not differ significantly from that of older cohorts; (2) the unemployed or jobless, individuals with few financial assets, and people who do not own their homes, i.e., borrowing-constrained individuals, are more likely to drop out from the national pension; and, (3) the probability of dropping out from the national pension system declines abruptly at around the age of 36.
JEL Classification: H55, D12, D52
Keywords:
Intergenerational inequality, Liquidity constraint, National pension
1. Introduction*
Although each Japanese resident aged from 20 to 60 has been legally mandated to subscribe to the national pension system (NPS) since 1961, the existence nowadays of a large number of premium defaulters and dropouts is a well-known fact. Category I subscribers, i.e., self-employed, farmers, part-time workers, and unemployed aged between 20 and 60 are not subject to payroll taxes, and are likely to default on premium payments or drop out. According to a survey of the Social Security Agency in 【182頁】20041), only 48.7% of category I subscribers have paid pension insurance premiums in full or have had a premium payment waived2) during the last two fiscal years (Apr. 2003-Mar. 2005). The remaining 51.3% of category I subscribers, however, have defaulted on premium payments either completely or partially. Specifically, 4.24 million subscribers defaulted on 24 straight months of premium payments and 6.95 million subscribers defaulted on 1-23 months of payments.
Besides, there are a large number of dropouts who have never subscribed to the national pension. Although the announced number of dropouts declined sharply from 1,928,000 (nearly 10% of all eligible candidates) in 1992 to 362,000 in 2004, this fall is merely a game involving figures. A new registration system was introduced in 1995 and social insurance offices were legally obliged to send subscriber certificates to dropouts. These certificate receivers are officially defined as “premium defaulters” instead of “dropouts,” even if they continued to refuse to make premium payments. As a result, the number of dropouts shrank after 1995, but the number of premium defaulters surged. Because 44.5% of premium defaulters show no intent to pay premiums either now or in the future3), the actual number of dropouts should be much larger than that announced by the government.
The total number of dropouts and premium defaulters, however, is rising rapidly (see Table 1). The proportion of defaulters and dropouts, i.e., non-compliance rate, rose from 27.0% in 1995 to 52.0% in 2004. Meanwhile, the ratio of premium payment months to due months declined from 85.7% in 1992 to 63.6% in 2004. This increasing number of premium defaulters and dropouts, of course, is a major threat to the national pension program. Because Japan’s national pension is operated under a pay-as-you-go system, that is, current pension payments are financed by current contributions, a radical decline in premium revenue is linked directly to a collapse of the public pension system. Japan’s rapid aging, however, makes this bad financial situation of the NPS even worse (Disney, 2000). Hence, finding out why non-compliance increased so fast and preferred strategies are becoming crucial policy issues.
Three categories of causes can be called upon to explain why so many people default on premium payments or drop out from the system. In the first category, we include liquidity constraint as a possible cause. Curme and Even (1995) use data from the 1983 Survey of Consumer Finances, and find evidence that borrowing-constrained U.S. workers are less likely to be covered by a pension plan. In the case of Japan, however, as many Japanese households have suffered from a job loss or an income cut due to the long economic slump in the 1990s, the number of borrowing-constrained households accordingly increased. These borrowing-constrained households regard the pension premium as a big economic burden, and choose to default on premium payments or to drop out from the NPS. The second category of cause is adverse selection4) associated with life expectancy; i.e., those who are in a bad health or whose parents died early because of inherited diseases believe they are likely to live a shorter lifespan 【183頁】than average, and have a stronger incentive to withdraw from the system. The third category of cause is adverse selection associated with intergenerational inequality; i.e., because the pay-as-you-go NPS is deemed to be a net income transfer from younger generations to older generations, younger generations, which are expected to suffer a net loss under the present system, have an incentive to default on premium payments or drop out. The liquidity constraint factor, if true, is a temporary problem because there is no permanent economic slump. Once the economy recovers, the number of premium defaulters and dropouts will decrease too. The life expectancy factor and the intergenerational inequality factor, however, provide supporting evidence for the adverse selection hypothesis. Given that these two factors are true, the NPS may need a fundamental amendment, or the number of premium defaulters and dropouts will not fall.
Using household level survey data, this present paper investigates what factors are significant in determining an individual’s non-compliance behavior in relation to the NPS. The organization of the paper is as follows: the literature review is set out in section 2; an overview of the pension system and a basic model are presented in section 3; and, data used in the analysis are described in section 4. The main empirical results are presented in section 5, and our conclusions are summarized in section 6.
2. Literature review
It was not until the 1990s that the problem of non-compliance in the NPS drew academic interest in Japan. The test that adverse selection really exists in the NPS dates back to Tsukahara (1997). In a self-constructed survey, Tsukahara (1997) made the first attempt to ask directly about the “participating willingness toward the NPS if subscribers can choose freely” and the “expected life expectancy” of each respondent. His survey results (tabulation mainly) reject the adverse selection hypothesis that subscribers with a shorter life expectancy are more likely to drop out from the pension system. On the other hand, later studies by Ogura and Kadoda (2000) and Suzuki and Zhou (2001) obtained supporting evidence for the adverse selection hypothesis. Using micro-data from the National Livelihood Survey, Ogura and Kadoda (2000) estimated a probit model for public pension and medical care insurance5) premium payments, and found that: a) factors such as present or past income, employment status, and age of individuals all significantly affect the probability of social security premium payment; and, b) young cohorts are more likely to default on premium payments. Using household data taken from the 1996 Survey on the Financial Asset Choice of Households, Suzuki and Zhou (2001) employ a bivariate probit model to estimate the participation choice of NPS and private pension insurance, and show that younger cohorts are more likely to drop out from the NPS. Hence, they emphasize that the distrust of younger generations toward the NPS could be one of the most important reasons for their non-compliance behavior. It is to be noted that a survey conducted by the Social Security Agency (2002) also shows that young subscribers, especially those aged 25-29, have a relatively high non-compliance rate6). While tentative, this 【184頁】result is also in accordance with the intergenerational inequality hypothesis.
A recent study by Abe (2001), however, casts doubt upon the validity of the adverse selection hypothesis. Using the 1996 Income Redistribution Survey, she concludes that neither raising the insurance premium nor the age of subscribers has a significant effect on the non-compliance probability of individuals. In other words, Abe (2001) indicates that intergenerational inequality might not necessarily be responsible for the increase of non-compliance with the NPS. While useful, all of the above studies have been criticized because the results are based on cross-sectional data, which confuse the age profile with the cohort effect. That is, even if those studies find a negative relationship between age and dropout rate, it might not necessarily mean that younger cohorts are more likely to drop out from the NPS than do older cohorts (Iwamoto and Ohtake and Oshio, 2002).
To identify the cohort effect on dropout rate, Abe (2004) tracked the same person over several years using retrospective information in the survey. Her analysis of the retrospective data, however, contradicts the adverse selection hypothesis that a young cohort is more likely to drop out from the NPS. While interesting, Abe (2004) suffers from at least two drawbacks: firstly, the survey sample is largely biased toward married women (aged 30 or over) whose choice depends largely on the economic status of the husband. Besides, samples of household head and other family members are pooled, even though family members other than the head might not really have the freedom to drop out; secondly, due to the linear relationship among year, cohort and age is ignored, the estimation result suffers from multicollinearity problem.
The present paper improves upon Abe (2004) by employing more representative samples from repeated cross-sectional data, and by focusing discussion on the behavior of household heads. Specifically, repeated annual data (1996, 1998, 2000, and 2002) from the Survey on the Financial Asset Choice of Households (SFACH) 7), a survey of nearly 4,000 households (per year) from throughout Japan, are pooled. Besides, this paper is the first attempt to separate cohort effect from age effect on dropout probability of NPS using the method of Deaton (1997).
3. Overview of NPS and Model for Non-compliance Behavior
To ensure all nationals enjoy universal pension benefits after retirement, and to respond to the adverse selection problem8), all residents in Japan have been required by law to join the basic layer of the public pension, i.e., the national pension insurance system (NPS), since 1961. Insurance premiums for full-time employees and public workers, i.e., category II subscribers, are proportional to their earnings, and are automatically withdrawn from their salaries each month. Non-working spouses of category I subscribers, i.e., category III subscribers, are exempted from insurance premium payments. The premi【185頁】um for self-employed, farmers, part-time workers, and unemployed (category I subscriber), however, is a flat rate9) and is not automatically deducted from earnings, but is collected by local social insurance offices (see Graph 1 for details). Hence, it is category I subscribers who have an opportunity to default on premium payments or to drop out from the pension system10).
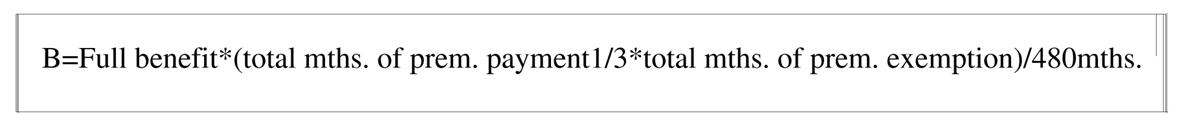
Turning to the pension benefit, subscribers who have subscribed to the NPS for a total of less than 25 years (<300 months) 11) have no qualification to claim pension benefits after retirement. Given that premiums are contributed until the age of 60, the age of 36 is the borderline age for eligibility to pension rights. Given that premiums are contributed until the age of 64, which is quite a rare case12), the age of 40 is the time limit for pension participation. Hence, a typical subscriber can default on premium payments or be a dropout from the NPS until the age of 35, but still be able to receive some pension benefit given that he or she pays premiums thereafter. The amount of pension benefits (B) for eligible candidates, however, depends on the length of their participation in years. I.e.,
where the full pension benefit is 792,100 Yen per year in 2006.
A behavioral model based on the above pension benefit system can be simplified as shown in Graph 2. For simplicity, we assume that the lifetime of an individual can be divided into two periods: the working period (period 1) and the retirement period (period 2). People use the labor income of period 1 (W1) to pay the pension premium and receive pension benefits for consumption during period 2.
Given that the national pension is the only pension available, W1-A-C-D will be the budget constraint line. A(C) and B(D) refer to the points at 25 years and 40 years of participation, respectively. As subscribers with a participation period of less than 25 years receive no pension benefits, the budget constraint line of W1A overlaps with the horizontal axis. The slope of CD, i.e.γp., represents the rate of return for the national pension. On the other hand, W1-G refers to the budget constraint line for using a private pension whose rate of return is ri, while the value of ri is slightly lower than that of rp (ri<rp)13). The national pension should have a higher rate of return than that of the private pension, not only because the NPS is managed on a non-profit basis, but also because one-third14) of the pension fund is contributed by 【186頁】the national treasury. Hence, Category I subscriber candidates should face a budget constraint like W1-H-C-D (black line in Graph 2).

Individuals maximize their total utility in period 1 and period 2 as follows,
![]() (2)
(2)
where u( )
is a quasi-concave utility function that fulfills the ordinary condition, and ![]() is
the life expectancy of individual i in the retirement period. For example, given
that the life expectancy of individual 1 is longer than that of individual 2,
the slope of the utility function of individual 1 should be flatter than that of
individual 215).
That is, the optimal consumption bundle of individual 1 (point where W1D
is at a tangent to U1)
should be above and to the left of that of individual 2 (point where W1D
is at a tangent to U2).
is
the life expectancy of individual i in the retirement period. For example, given
that the life expectancy of individual 1 is longer than that of individual 2,
the slope of the utility function of individual 1 should be flatter than that of
individual 215).
That is, the optimal consumption bundle of individual 1 (point where W1D
is at a tangent to U1)
should be above and to the left of that of individual 2 (point where W1D
is at a tangent to U2).
The optimal length of participating years, however, depends on life expectancy. People with a low risk of longevity will choose a shorter participation period, which is close to the minimum limit of 25 years, and people with a high risk of longevity will, of course, choose to join the national pension 【187頁】system for as long as possible. Given that a person’s life expectancy an extremely short, i.e., the indifference utility curve is U3, he or she might prefer to join a private pension instead of the national pension system. Hence, the phenomenon of adverse selection is absolutely a real possibility.
Special attention should be paid to the turning point C, where many people would otherwise have chosen a lower-right point of consumption bundle given that their national pension budget line is continuous (for example, people who have an indifference curve of U2). That is, an unnaturally prevalent number of subscribers could possibly choose a consumption bundle at point C. Because the age limits for fulfilling the 25-year participation prerequisite are the ages of 36 and 40, as we mentioned before, the participation rate of these ages should be notably higher than those of neighboring age groups.
Another concern of this paper is intergenerational inequality. According to the simulation of Hatta and Oguchi (1999), the birth cohort of 1935 will have a net gain of 9.71 million Yen under the pay-as-you-go public pension system, while in contrast, the birth cohort of 1995 will have a net loss of 3.02 million Yen16). In Graph 2, the line W1-A-E-F depicts the public pension budget constraint line for younger generations facing a net loss from the public pension system. The rate of return of the national pension for these younger generations (r’p) is assumed to be even lower than that of private pensions. Because their budget constraint line for a private pension is always above that of the national pension, a private pension should always be preferred over the national pension regardless of life expectancies. Hence, given that the intergenerational inequality hypothesis tells the true story, the younger cohorts will have a higher probability of dropping out from the NPS or of purchasing a private pension than the older cohorts.
Meanwhile, theoretically, the existence of a liquidity constraint might be tested by investigating whether or not the consumption amount of period 1 neighbors point W1. If so, we may say that the liquidity constraint crowds out his or her optimal option of joining the NPS.
4. Data and Descriptive Statistics
This paper uses repeated cross-sectional data (1996, 1998, 2000, and 2002) for the Survey on the Financial Asset Choice of Households (SFACH), which is a national survey conducted by the Japan Post Research Institute every two years. Although initially designed for studies on household saving and portfolio choice, SFACH also contains information concerning enrollment in national pension and choice of private pension17) among household members. Besides, this survey includes detailed information on the attributes of household heads such as gender, age, employment status, education, residence, income, and amounts of financial assets and real assets18).
Households with a head aged 20 or over are randomly selected throughout the country’s 47 pre【188頁】fectures on the basis of a multiple-stage stratified sampling procedure. The total number of samples is 6,000 in 1996 (with 3,695 valid samples and a valid response rate of 61.6%; 6,000 in 1998(with 3,754 valid samples and a valid response rate of 62.6%; 5,010 in 2000(with 3,111 valid samples and a valid response rate of 62.1%); and, 9,000 in 2002(with 5,583 valid samples and valid response rate of 62.0%). Although the number of samples differs slightly year-by-year, the sampling procedure is unchanged, and the rate of valid response is constant. Hence, a pool of these data can be regarded as repeated cross-sectional data that is time serially comparable.
To single out the sort of category I subscribers who are in fact capable of non-compliance behavior related to the NPS, this paper restricts samples to household heads19) aged between 20 and 59, who are either merely contributing to the basic layer of the public pension (Category I subscribers) 20) or dropouts from the public pension. Among the 2,543 selected samples, 16.3% (n=413) of respondents admitted to being a dropout from the NPS. Therefore, this paper defines the dropout rate as follows:

The dropout rate from NPS and the purchase rate of private pensions by year, however, are summarized in Graph 3. Graph 3 shows that the dropout rate from the public pension is rising, while the purchase rate of private pensions has been declining recently. For example, the dropout rate from NPS was as high as 22.7% in 2002, which is 12.6 points higher than that in 1996. The purchase rate of private pensions, however, fell from 31.2% in 1996 to 19.9% in 2002. The rise in the dropout rate from NPS just reflects the fact that more and more category I candidates are fading from the national pension system, while the decline of the purchase rate of private pensions is possibly due to the long economic slump. It is to be noted that the magnitude of the dropout rate in Graph 3 is significantly higher than the figures announced by the Social Security Agency (i.e., 2.8% in 2001)21). As we mentioned, only those candidates who have never enrolled in the NPS are defined as “dropouts” by the Social Security Agency. However, in fact, a large proportion of premium defaulters have no willingness to pay the premium either now or in the future. Because these discouraged premium defaulters are very likely to admit to being dropouts from the NPS, our figures should be closer to the virtual dropout rates than those announced by the Social Security Agency.
Graphs 4-1 and 4-2 depict the dropout rate from the national pension and the purchase rate of private pensions by age group, respectively. Graph 4-1 confirms the findings of Graph 3s and shows that the dropout rate from the national pension rose among almost all age groups. The dropout rate for the two youngest groups, i.e., 20-24 and 25-29, rose particularly fast. In consequence, 50.4% of those aged 20-24 and 32.2% of those aged 25-29 were dropouts from the national pension in 2002. Graph 4-1 also 【189頁】indicates that the dropout rate from the national pension generally declines with age; and, just as expected, it declines dramatically at the point for the 35 to 39 age group. Graph 4-2, on the other hand, shows that the purchase rate of private pensions rises with age. The overall purchase rate of private pensions, however, showed a declining tendency after 2000.
Table 2 presents a comparison of contributors and dropouts, and indicates that dropouts are on average in a worse economic condition than contributors. Specifically, the average annual household income of dropouts is 3.83 million Yen, while that of contributors is 5.84 million Yen. Dropouts also have fewer financial assets and a higher rate of unemployment or joblessness than do contributors. Possibly because of their relatively poor economic conditions, the purchase rate of private pensions among dropouts is notably lower than that among contributors. Besides, dropouts have a lower average age and a higher probability of living in large cities than do contributors. Although tentative, the above results are generally consistent with the investigations of the Social Security Agency.
5. Empirical Model and Estimation Results
The hypotheses concerning with the motivations for dropping out from the NPS and for purchasing private pensions are verified by estimating the following two functions:


Equations (1) and (2) are defined as the “function for dropouts from the national pension” and the “function for the purchase of private pensions,” respectively. Here, Mi* is a latent variable, which indicates the difference in utility when an individual drops out from the system and when he remains contributing to the system. When the gap is positive (Mi*>0),optimal individuals will choose to withdraw from the national pension system. Nevertheless, instead of observing Mi*, we observe only Mi, which is a binary variable indicating the sign of Mi*. Similarly, Pi* is a latent variable representing the difference in utility when purchasing a private pension and when purchasing no private pension. Pi is an observable binary variable indicating the sign of Pi*.
【190頁】
Both functions share the same set of explanatory variables. Firstly, age dummies (Ai), cohort dummies (Ci), and year dummies (Yi) are taken into account. We define age dummies and cohort dummies in four-age-intervals. The problem lies in the fact that if we know the year, and we know when a cohort was born, then we can infer the cohort’s age. That is, the variables of age, cohort, and year dummies are not one-order independent. To deal with this problem, we employ the approach proposed by Deaton (1997) 22), which is to set a constraint on the coefficients of year dummies to let their sum equal zero when performing the estimations.
Other explanatory variables include jobless dummy Ui (1 if unemployed or jobless, 0 otherwise), household income Ii, financial assets Fi, Home ownership dummy Ri (1 if owns a home, 0 otherwise), gender dummy Si (1 if male, 0 otherwise), household members Ki, and large city dummy Ti (1 if resides in cities with a population of more than 150,000, 0 otherwise).
Turning to the estimation method for equations (1) and (2), we employ the Bivariate Probit Model (BPM), taking into account that the choice of dropping out from the national pension could be closely correlated with the choice to purchase a private pension. Specifically, BPM assumes mutually correlated error terms between equations (1) and (2), and defines the accumulative distribution of the likelihood function as follows:

where

We test the previously mentioned hypotheses by analyzing the signs of coefficient estimates. Specifically, given that the liquidity constraint hypothesis is true, the sign for the estimates of jobless dummy, financial assets, and household income should be positive, negative, and negative, respectively. Given that the intergenerational inequality hypothesis is valid, the younger cohorts should be more likely 【191頁】to drop out from the national pension, and to purchase a private pension than do the older cohorts. That is, the estimates of younger cohort dummies should be positive in both equations. The test for the life expectancy hypothesis, however, is impossible using our data23).
The estimation results are presented at Table 3. Firstly, the correlation coefficient for the error terms (ρ) is statistically significant, and this suggests that the Bivariate Probit Model is appropriate. Secondly, the estimation result of Equation (1), i.e., the function for the dropout behavior related to the national pension, shows that coefficients for jobless dummy, financial assets, and home ownership dummy are all statistically significant, and their signs are integrated with the liquidity constraint hypothesis. Specifically, the unemployed or jobless, individuals with fewer financial assets, and people who do not own their homes, i.e., those who are more likely to face a liquidity constraint, have a higher probability of dropping out from the national pension system. Besides, people living in large cities are more likely to drop out from the national pension system.
To give a clearly understandable explanation about the effects of age and cohort on dropout probability, we plot the coefficients of cohort dummies and age dummies selectively in Graphs 5-1 and 5-2, using the estimation results of equation (1). Although the intergenerational inequality hypothesis predicts a higher dropout probability for the younger cohorts, Graph 5-1 shows no supporting evidence for this hypothesis. Before this point, none of the cohort dummies are statistically significant. Turning to age effect, Graph 5-2 indicates that the dropout probability of younger people is higher than that of older people, and coefficients for the young age dummies are statistically significant as well (see Table 3 for details). Interestingly, the magnitude of the age dummy coefficient drops abruptly around the age dummy 36-39. This finding, however, coincides with our earlier expectations that eligible candidates around the age of 36 will rush to join in the national pension in order to fulfill the 25-year participation prerequisite.
To examine the hypothesis that the 25-year participation prerequisite provokes a participation rush at around the age of 36 strictly, we performed a Wald Test on the null hypotheses that the coefficients of neighboring age dummies equal each other. Table 4 indicates that the null hypotheses cannot be rejected in almost all cases (cases 1 to 8), with the exception of case 4. The null hypothesis of case 4 that the coefficient of age dummy 32-35 equals that of age dummy 36-39, however, is rejected by the 5% significance level. That is, coefficients of age dummies for these two age groups differ significantly from each other. Similar results can be obtained when employing a longer span between age dummies such as a comparison of coefficients between age dummies 28-35 and 36-43 (see Case 9). On the other hand, cases 10 to 12 verify whether the magnitude of age dummy coefficient varies notably at around the age of 40, which is the borderline age for pension benefit eligibility when voluntary enrollment (Ninyi Kanyu) in NPS is allowed. As we can see, either when a relatively short span (case 10) or when a relatively long span of age dummies (cases 11 and 12) is used, the coefficient of the age dummy under 35 differs significantly from that of the age of 40 or over. Hence, the finding that the dropout probability declines sharply around the age of 36 is statistically robust.
【192頁】
Turning to the determinants of private pension purchase, the right half of Table 3 shows that jobless dummy, financial assets, and home ownership are statistically significant factors. People in worse economic conditions (unemployed or jobless, individuals with fewer financial assets, and people who do not own their homes) are generally less likely to purchase a private pension. Besides, age also has a significant effect on private pension purchase given constant cohort and year. The private pension purchase probability of younger people (ages 20-23, 24-27, 28-31, and ages 40-43) is significantly lower than that of older people (ages 55-59).
6. Conclusions
Although each Japanese resident from the age of 20 to 60 is legally mandated to become a contributor to the national pension system (NPS), there are an increasing number of premium defaulters and dropouts from the system. Because Japan’s national pension is operated under a pay-as-you-go system, a radical decline in premium revenue is directly linked to a collapse of public pension system. Even so, few empirical analyses concerning non-compliance behavior toward the NPS have been conducted. The purpose of the present paper is to investigate why so many people defaulted on premiums or dropped out from the NPS using household-level data from a Japanese Government Survey. In brief, a theoretical model explaining an individual’s dropout behavior is first presented, and then an empirical model (Bivariate Probit Model), which takes into account the correlation between the choices of dropping out from the national pension and purchasing a private pension, is introduced. Our estimation results can be summarized as follows:
(1) Intergenerational inequality might not be an important cause of the increasing premium defaulters and dropouts from the national pension. After separating the age profile from the cohort effect, we find that although the probability of dropping out from the NPS among younger people is significantly higher than that among older people, and there is no significant difference between young and old cohorts. This finding is broadly consistent with that of Abe (2001, 2004), i.e., the adverse selection associated with intergenerational inequality might not be responsible for the increase of non-compliance with the NPS.
(2) The increasing number of liquidity-constrained households could have enhanced non-compliance behavior toward NPS. The unemployed or jobless, individuals with fewer financial assets and people who do not own their homes, i.e., those who are more likely to face a liquidity constraint, have a higher probability of dropping out from the national pension.
(3) The probability of dropping out from the NPS declines abruptly at around the age of 36. This finding provides supporting evidence for our hypothesis that the 25-year participation perquisite for pension benefit claims will induce a prevailing number of hurried enrollments at around the borderline age.
It is to be noted that this paper uses four repeated cross-sectional surveys from 1996 to 2002 in decomposing cohort and age effects. Six years, however, might not be sufficient to separate the cohort and age effects between the very young and the very old cohorts. Hence, our conclusion concerning the 【193頁】invalidity of the intergenerational inequality hypothesis should be interpreted as being limited to the relatively proximate cohorts. A strict test of the intergenerational inequality hypothesis regarding the very young and the very old cohorts24) should be verified using more surveys and data covering a longer time span.
References
Abe, A (2004) “A Study on the Dropout Period of National Pension・A Panel Data Analysis” (in Japanese), Quarterly Journal of Social Security (Kikan Shakai Hosho Kenkyu), Vol.39(No.3), pp.268-280
Abe, A (2001) “How Does the Reform of Premium Exemption System Affect the Dropout, and Premium Defaulting Behavior Toward the National Pension”(in Japanese), Japanese Economic Research (Nihon Keizai Kenkyu), No.43,134-154.
Curme, M. A. and Even, W. (1995)“Pension Coverage and Borrowing Constraints,” The Journal of Human Resources, Vol.30, No.4, 701-712
Deaton, A(1997) The Analysis of Household Surveys, Johns Hopkins University Press
Disney, R. (2000) “Crises in Public Pension Programmes in OECD: What Are the Reform Options,” The Economic Journal, Vol.110, No.461, F1-F23
Hatta, T. and Oguchi, Y. (1999) Comment on the Pension Reform・From the Pay-as-you-go System to the Funded Pension System (in Japanese), Nihon Keizai Shinbun Press, Tokyo.
Iwamoto, Y. and Ohtake, F. and Oshio, T. (2002) “Meeting: Pension Research Today” (in Japanese), Quarterly Journal of Social Security (Kikan Shakai Hosho Kenkyu), Vol.37 No.4, 316-349.
Ogura, S. and Kadoda, T. (2000) “A Study on the Payment and Collection of Social Security Premium by Using Household Data” (in Japanese), Economic Research (Keizai Kenkyu), Vol.51 No.2, pp.98-110
Suzuki W. and Zhou, Y. (2001) “An Economic Analysis on the Dropout Behavior of National Pension” (in Japanese), Japanese Economic Research (Nihon Keizai Kenkyu), No.42, 44-60
Suzuki W. and Zhou, Y. (2006)“An Economic analysis of the Uninsured within the National Pension System in Japan・Does the Cohort Effect Really Exist?”(in Japanese), The Quarterly Of Social Security Research (Kikan Shakai Hosho Kenkyu), No.41,385-395
【194頁】
Table 1 Number of Dropouts and Complete Defaulters from the NPIS (Unit: thousand)

Notes:
(1)Dropouts are eligible candidates who never subscribed to the national pension insurance system. Complete defaulters are those who have defaulted on premium payments for 24 straight months during the last 2 years.
(2)Non-compliance rate = (A+B+C)/(A+E); Payment rate=(paid months)/(paid months + unpaid months).
(3)Source for A: Survey of Participation Condition of Public Pension by SSA. Source for others: A Survey on the Subscribers of National Pension SSA.
Graph 1 Structure of Public Pension System

Note: Number of subscribers in March 2002 is shown in parentheses.
Graph 3 Dropout Rate for Public Pension and Purchase Rate of Private Pensions

Source: Authors’ calculation based on the individual data of SFACH.
【195頁】
Graph 4-1 Dropout Rate for National Pension by Age Group

Graph 4-2 Purchase Rate of Private Pensions by Age Group

Table 2 Descriptive Statistics

Note: Income and assets are consumer price-deflated (2000 as a base year) amounts, and the unit is 10,000 Yen.
【196頁】
Table 3 Estimation Results of Equations (1) and (2)

Notes:
Bivariate Probit Model with coefficient constraint (N=2,073). That is, sum of the coefficients for year dummies is set at zero.
(2) Benchmarks for age dummies, cohort dummies, and year dummies are age 56-59, 1937-1944 birth cohort and year 1996 respectively.
(3) Log pseudo-likelihood = -1823.6332.
(4)*,**,*** significant at the 10%, 5%, and 1% levels, respectively.
【197頁】
Graph 5-1 Plot of Coefficients for Cohort dummies

Note: Figures based on the estimation result of equation 1 (see Table 3 for details).
Graph 5-2 Plot of Coefficients for Age Dummies

Note: Figures based on the estimation result of equation 1 (see Table 3 for details).
【198頁】
Table 4 Wald Test on Equality of Age Coefficients

Notes:
(1)Wald Tests based on the estimation result of equation (1).
(2)α is the coefficient of age dummy.