�y181�Łz
Family
Ownership, Investment Behavior,�@and Firm Performance
——Evidence
from Japanese Electric Machinery Industry——
Shigeru Asaba and Eiji Kunugita
Abstract
We studied family firms in the
Japanese electric machinery industry.
First, we compared firm performance between family and non-family firms,
and found that family firms show higher profitability. Second, we tried to distinguish among
reasons for better performance of family firms. The results of several t-tests and
regression analyses suggest that selecting top management from the pool
restricted to the family is not an important disadvantage of family firms. They also suggest that neither combining
ownership and control nor holding large equity share is the advantage of family
firms. On the other hand, family
firms in the sample invest in capacity significantly more than non-family firms
in the 1990s. Therefore, longer
investment horizons of family firms may be the reason for better performance,
especially during the low growth era.
�T�DIntroduction
In contrast to Berle and Means's view that
ownership is separated from management in modern corporations, several studies
reported that family-owned firms are prevalent in the world. Family businesses occupy one third of
Standard and Poor's 500 (Anderson et al., 2003). Family firms comprise 80% to 90% of all
business enterprises in
Family ownership is widely believed
to be less efficient than dispersed ownership. Fama and
Jensen (1983) argue that the combining ownership and control may allow founding
families to exchange profits for private rents. Demsetz (1983)
discusses that founding families may choose nonpecuniary
consumption and draw scarce resources away from profitable projects. Families also often choose CEO from the
pool restricted to family members, suggesting that difficulty to obtain
qualified and capable talent continuously, potentially leading to competitive
disadvantages relative to non-family firms (Anderson and Reeb, 2003).
Nevertheless, several excellent
companies in the world are family-owned firms. Salvatore Ferragamo, �y182�Łzfor example, has been
soundly managed in apparel industry without speculation or irrelevant
diversification. Samsung Electronics,
for example, has grown in semiconductor industries by aggressive
investment. Not only have case
studies of individual firms but also systematic empirical analyses found better
performance of family firms. McConaughy et al. (2001) find that
family firms have greater value, are operated more efficiently, and carry less
debt than non-family firms.
Anderson and Reeb (2003)
also find that family firms perform better than non-family firms.
There are several literatures
suggesting the benefits of family firms.
Demsetz and Lehn (1985) argue
that family members with large equity share have substantial economic
incentives to diminish agency conflicts and maximize firm value. James (1999) points out that families
have longer investment horizons, resulting in greater investment
efficiency. Stein (1988; 1989)
discusses how the presence of shareholders with relatively long investment
horizons can mitigate the incentives for myopic investment decisions by
managers.
As described above, existing studies
provide both advantages and disadvantages of family businesses, while empirical
analyses show better performance of family firms in the
The structure of this paper is as
follows: The next section briefly
reviews existing studies on family firms, and establishes several
hypotheses. Section III discusses
the data and the method. Section IV
shows the empirical results.
Section V discusses about the results and provides a summary and future
research agenda.
�U�DTheories and Hypotheses
It is widely believed that founding
families tend to take actions that benefit themselves at the expense of firm
performance. Fama and Jensen (1985) argue
that large shareholders employ different investment decision rules from
diversified shareholders, who are supposed to evaluate investments using market
value rules that maximize the value of the firms' residual cash flows.
Selecting CEO from the pool
restricted to family members can be another reason for poor performance of
family firms relative to non-family firms.
Schleifer and Vishny (1987) suggest that
large shareholders remain active in management even if they are no longer
competent and qualified to run the firm.
Families can also expropriate wealth
from the firm through excessive compensation, special dividends, and so
on. Shleifer and Summers (1988) argue that
families have incentives to redistribute rents from employees to
themselves. Family's action to
maximize their personal utility potentially results in poor firm performance
relative to non-family firms.
On the other hand, several
researchers point out the advantages of family firms. Demsetz and
Lehn �y183���z(1985) argue that families have strong
incentives to monitor managers and minimize the free rider problem inherent
with atomistic shareholders, because the family' wealth is closely linked to
firm welfare and because the family have knowledge of the firm's technology
necessary to monitor managers.
Families may be willing to invest in
long-term projects because they have longer horizons than other shareholders
(Stein, 1988; 1989; James, 1999).
Since founding families regard their firms as an asset to pass on to
their descendants rather than wealth to consume during their lifetime, firm
survival is an important concern for families. Therefore, family firms may maximize
long-term value (Casson, 1999).
Since existing literatures point out
both advantages and disadvantages of family firms, we set two alternative
hypotheses.
Hypothesis
1a: Family firms perform better
than non-family firms.
Hypothesis
1b: Non-family firms perform better
than family firms.
Supposing that we will find that
family firms perform better than non-family firms (consistent with Hypothesis 1a) like many existing
empirical studies, we will explore why family firms perform well. The disadvantages of family firms
pointed out by existing studies are broadly classified into two: prodigality or
divergence from maximization of firm value and incompetent and unqualified
managers chosen from the restricted pool of family members. This paper will examine the latter.
Founders may find it difficult to
choose a qualified successor from their family. Therefore, firms run by the
founders perform better than those run by the successors from their
family. If families understand such
a disadvantage, they may search for a talented manager from larger pool. As a result, they continue to own their
firms, but appoint CEO from outside the family. If so, family firms run by non-family
members perform better than those run by the successors from the family. Therefore, we set the following
hypotheses:
Hypothesis
2: Firms run by the founders perform better than those run by the successors
selected from the family.
Hypothesis
3: Family firms run by non-family members perform better than those run by
successors from the family.
Existing studies pointed out two
kinds of advantages of family firms: less agency conflict and longer investment
horizons. If combining ownership
and control, which mitigates agency conflict, is the reason for better
performance of family firms, firms not only owned by the families but also run
by the CEO from the family members should perform well. In the firms owned by the families but
run by CEO from outside the family members, however, ownership is separated
from management. Therefore, they
should not perform as well as the family firms combining ownership and
control. Thus, we have the
following hypothesis:
�y184�ŁzHypothesis 4: Family firms not only owned by the families but also
run by the CEO from the family members perform better than the firms owned by
the families but run by the CEO from outside the family members.
The reason for better performance of
family firms may be not combining ownership and management but large equity
share owned by family. Because the
families who are large shareholders have strong incentives to monitor managers
and mitigate agency problems, even firms owned by the family members with large
equity share but run by the CEO from outside the family members may perform
well. However this reason is not
applied only to family firms. Firms
owned by large but non-family shareholders should also perform well. Thus, we have the following hypothesis:
Hypothesis
5: Firms owned by large but non-family shareholders perform as well as family
firms.
If family firms have longer investment
horizons, they can invest in long-term project non-family firms cannot invest
in. As a result, family firms tend
to make more aggressive investment.
Moreover, non-family firms may adjust investment level to economic
conditions frequently, while family firms are patient enough to keep their
investment level. Therefore, we set
the hypotheses as follows:
Hypothesis
6: Family firms invest more than non-family firms.
Hypothesis
7: Family firms show more stable investment than non-family firms.
These hypotheses will be tested in
this paper to compare the performance between family and non-family firms, and
distinguish among the reason for the better performance of family firms.
�V�DData and Methods
(1)
Sample
In this study, we collected the data
of the electric machinery manufacturers in
Then, we collected the data of the
equity share of ten largest shareholders from Yuka Shoken Hokoku-sho of each firm. We regarded the shareholders whose
family name is the same as that of the founder, as founding family members, and
considered that sum of the equity share of founding family members is the
family share�R. Moreover, we examined if the current
president or chairman is the family �y185�Łzmembers.
Family businesses can be defined in
terms of management and in term of ownership. We have three kinds of family business
dummy variables. First, FB1 is equal to 1 if the president or
the chairman of the firms is from the founding family, and 0
otherwise. Second, FB2 is equal to 1 if family member is
listed in the top 10 shareholders, and 0
otherwise. Third, FB3 is equal to 1 if the equity share of
family among the 10 largest shareholders is more than 5%, and 0 otherwise. Out of 190 sample firms, 69 firms are
run by the founding family (FB1=1),
80 firms are owned by the family (FB2=1), and 51 firms are largely owned by the
family (FB3=1).
(2)
Variables and Methods
First, to know if there is
significant difference in performance between family and non-family firms (Hypothesis 1a and 1b), we will
perform t-tests for difference in means of performance. As performance measures, we construct
the return on asset (ROAt) and the sales growth
rate (AAGRt). ROAt is the average of ROA of
a firm in each year during the period t, and AAGRt is the average annual
growth rate of the sales during the period t. We set the three periods: from 1992 to
2005 (whole sample period), from 1992 to 1998 (depression), and from 1999 to
2005 (recovery)�S.
Second, we will examine if the
selection of the top management from the pool restricted to the family members
causes a disadvantage of family firms.
To do so, we will divide the family firms run by founding family members
(FB1=1) into those run by the
founders and those run by the successors of family members. Then, we will perform t-tests for
difference in means of performance between the two (Hypothesis 2). If
restricted pool causes a disadvantage, we expect that family firms run by the
founder perform significantly better than those run by the successors of family
members. We will also divide family
firms into those run by the successor of family members (FB2=1 and Successor) and those run by non-family members (FB2=1 and FB1=0), and will perform t-tests for difference in means of
performance (Hypothesis 3). If restricted pool causes a
disadvantage, we expect that family firms run by non-family members perform
significantly better than those run by the family members.
Third, we will examine if combining
ownership and control is the advantage of family firms. To do so, we will perform t-tests for
difference in means of performance between family firms not only owned by the
families but also run by the CEO from the family members (FB2=1 and FB1=1) and the
firms owned by the families but run by the CEO from outside the family members
(FB2=1 and FB1=0) (Hypothesis 4).
Fourth, we will examine if not
combining ownership and management but large equity share resulting in strong
incentive to monitor managers is the advantage of family firms (Hypothesis 5). To do so, we will run the
regressions. Dependent variables
are several kinds of performance measure described above. Independent variables are dummy
variables of family firms owned by family members (FB2) and equity share of the largest shareholders (Largest_Share). If not being owned by family members but
being owned by large shareholders is the reason for better performance, Largest_Share as well
as FB2 �y186�Łzshould have significantly
positive coefficient We will also
include several control variables described below.
Finally, to examine any impacts of
ownership structure on investment behavior, we will run the regressions. As dependent variables, two kinds of
investment, R&D investment (RDRt and CVRDRt) and
capacity investment (CAPRt and CVCAPRt), will
be examined. RDRt is the
average of R&D sales ratio of a firm in each year during the period t, and CAPRt is the
average of capacity investment divided by sales of a firm in each year during
the period t (t=1994-2005, 1994-1998, 1999-2005). CVRDRt is the
coefficient of variation of R&D sales ratios in each year during the period
t and CVCAPRt is the
coefficient of variation of capacity investment divided by sales in each year
during the period t.
Independent variables are family firm
dummies such as FB1, FB2, and FB3. In addition to
them, we will include several control variables. AGE is the number of years from the year when the firm was
established to 2005. DEBTR is debt ratio. EMP
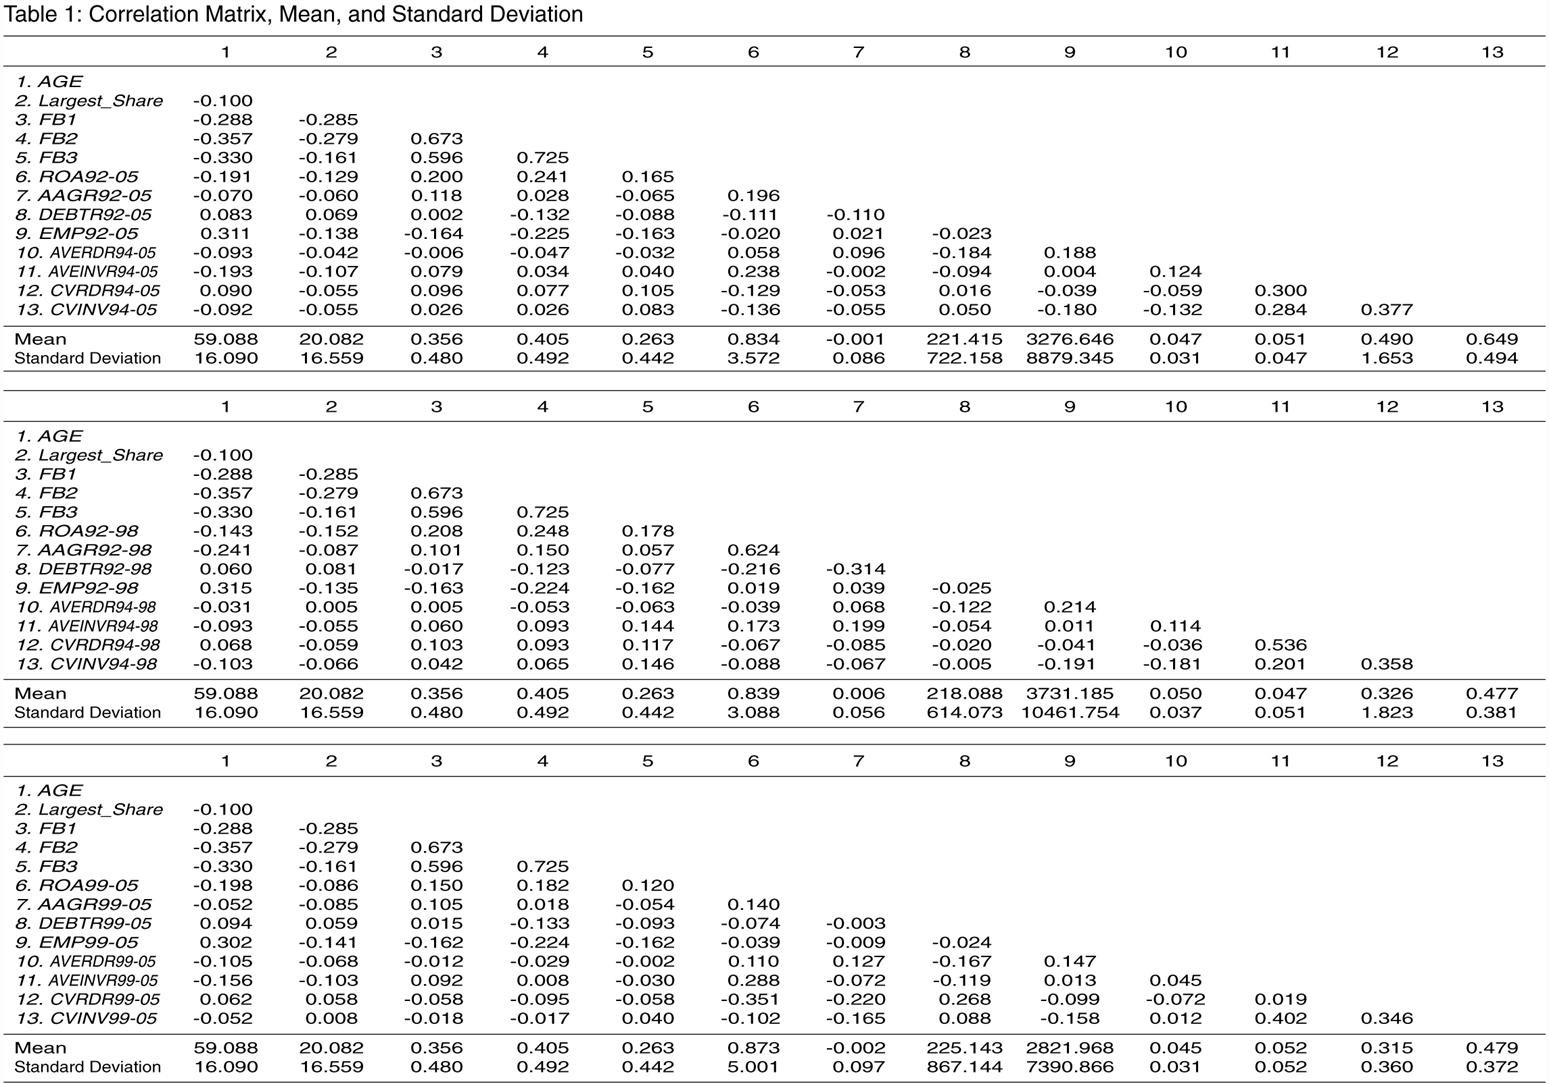
is the number of employees, which stands for the size of the firm. We also include ROAt and Largest_Share. The mean, standard deviation, and
correlation matrix of the variables are indicated in Table 1.
�y187�Łz
�y188�Łz
�W�DResults
(1)
T-Test
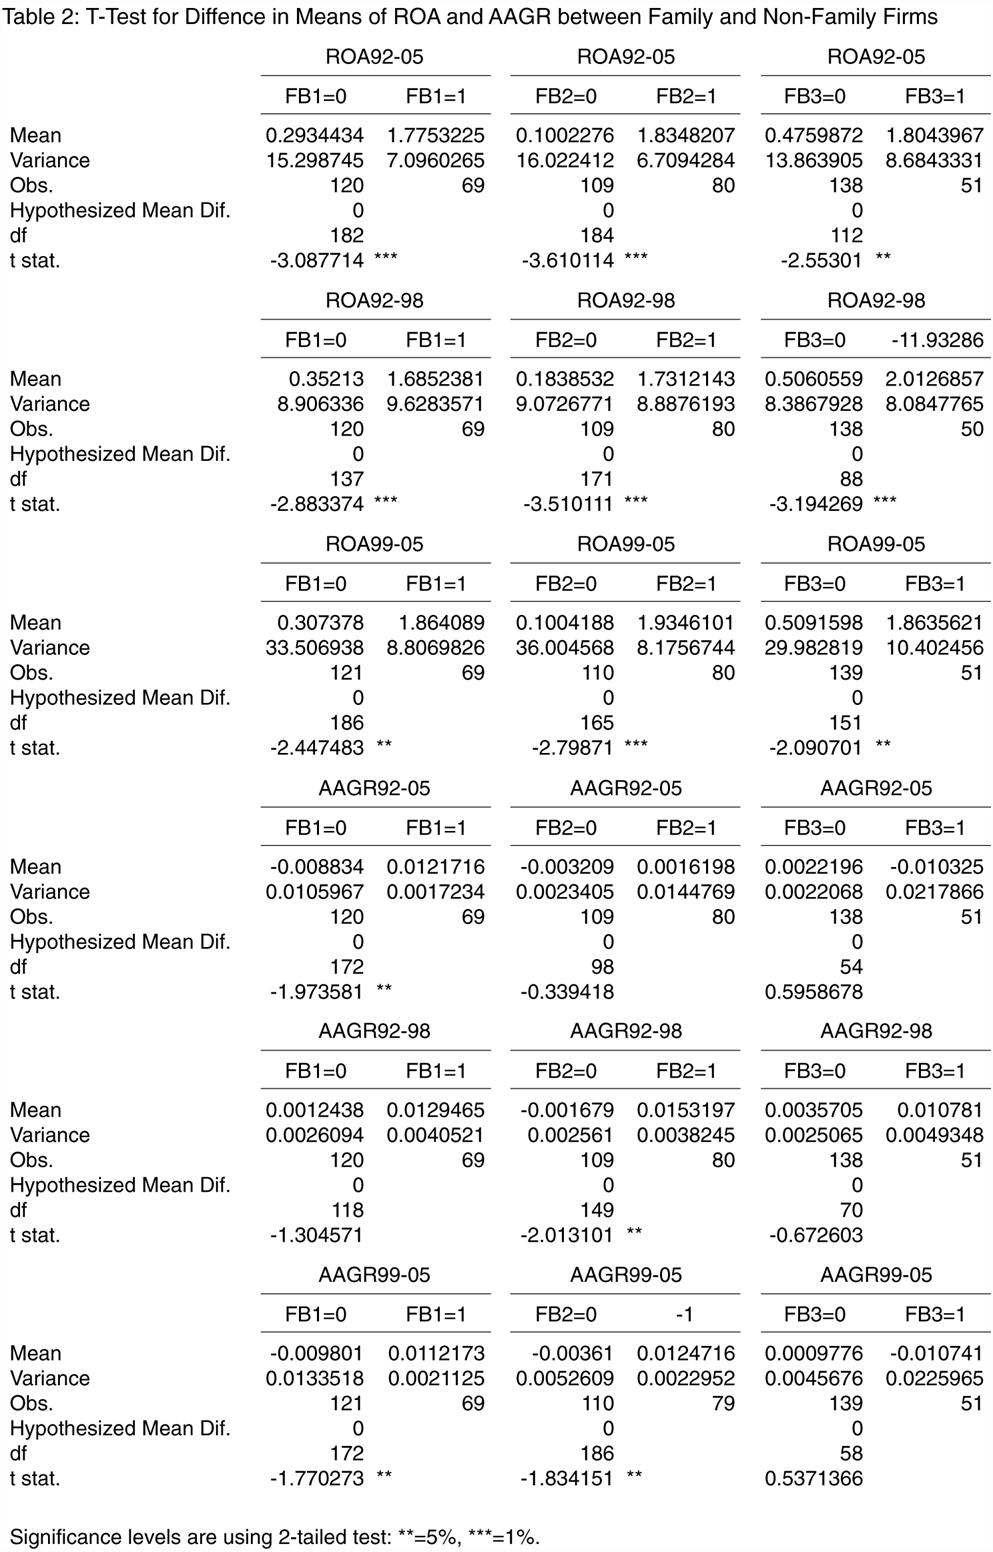
First, the results of the t-tests for
difference in means of performance between family and non-family firms are
shown in Table 2. Regarding ROA, any
kinds of family firms perform significantly better than non-family firms. Regarding sales growth rate, the results
are mixed. The firms run by the
family members (FB1) grow
significantly more than non-family firms from 1992 to 2005 and from 1999 to 2005,
but the difference in growth rate from 1992 to 1998 is insignificant. The firms owned by the family members (FB2) grow significantly more than
non-family firms from 1992 to 1998 and from 1999 to 2005, but the difference in
growth rate from 1992 to 2005 is insignificant. The firms owned by the family members
with more than 5% of equity share (FB3)
do not grow significantly more than non-family firms during any periods. Thus, Hypothesis 1a is clearly supported in terms of ROA, and partially
supported in terms of sales growth rate, while Hypothesis 1b is rejected.
In sum, in the Japanese electric machinery manufacturers, family firms
perform better than non-family firms as the existing empirical analyses in the
different contexts found.
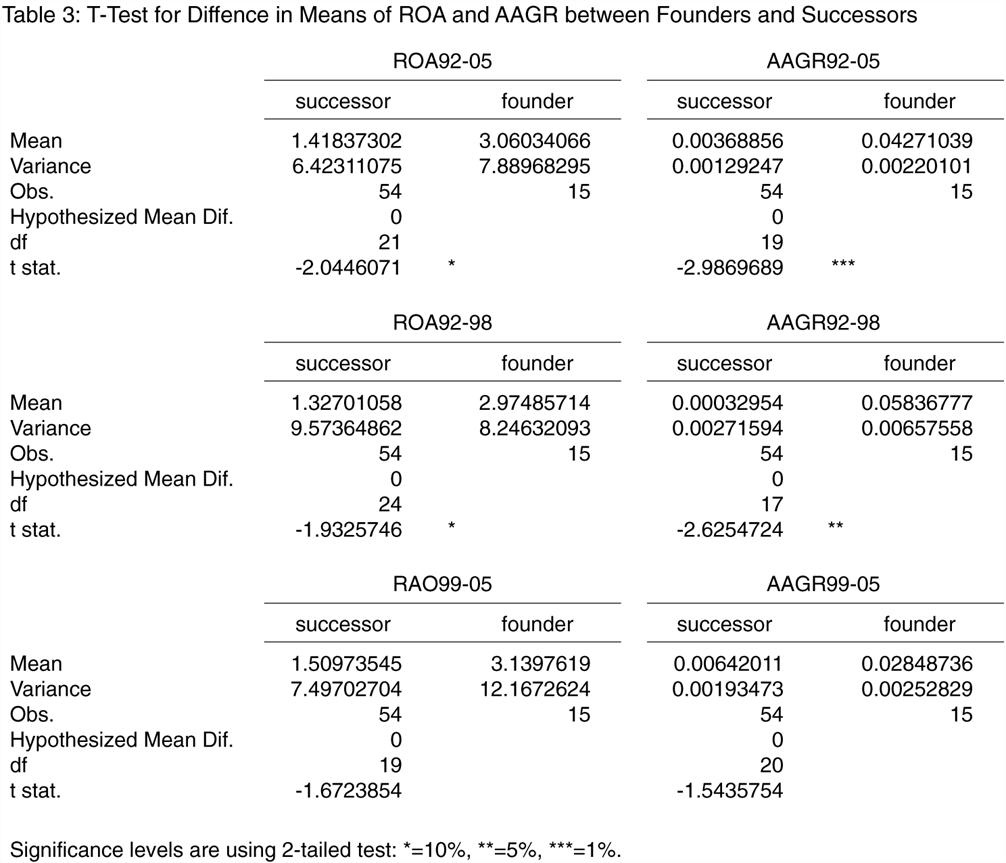
Second, the results of the t-tests
for difference in means of performance between family firms run by the founders
and those run by the successors are shown in Table 3. In terms of ROA as well as sales growth
rate, family firms run by the founders perform better than family firms run by
the successors from 1992 to 2005 and from 1992 to 1998. Therefore, during these periods, Hypothesis 2 is supported. This suggests that the family may have
difficulty to obtain qualified and capable CEO from the pool restricted to the
family members.
However, the difference in
performance may not be caused by the difference between founders and
successors. Family firms run by the
founders are relatively young. Therefore,
better performance of the family firms run by the founders may be caused not by
the difference in top management (founders vs. successors) but by the
difference in youth. Insignificant
difference in performance from 1999 to 2005 when age difference between the two
kinds of firms relatively decreases is consistent with the latter
interpretation.
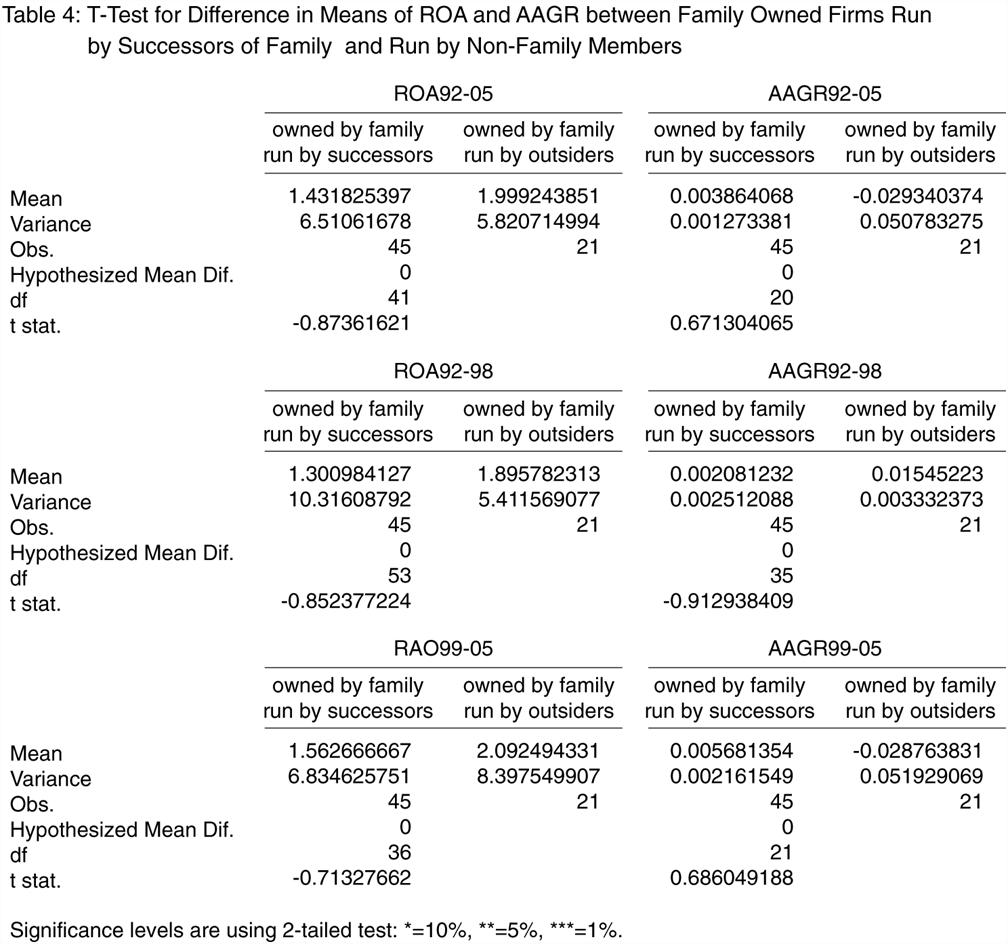
The results of another test examining
if selection of managers from restricted pool of family members is the
disadvantage of family firms are indicated in Table 4. Different from the results in Table 3,
any specifications in Table 4 do not show significant difference. That is, there is no significant
difference in performance between family owned firms run by the successors from
family members and those run by non-family members. Thus, Hypothesis 3 is rejected.
Expanding the pool of managers to outside families does not improve
performance. This suggests that the
pool restricted to the family members does not cause disadvantages of family
firms.
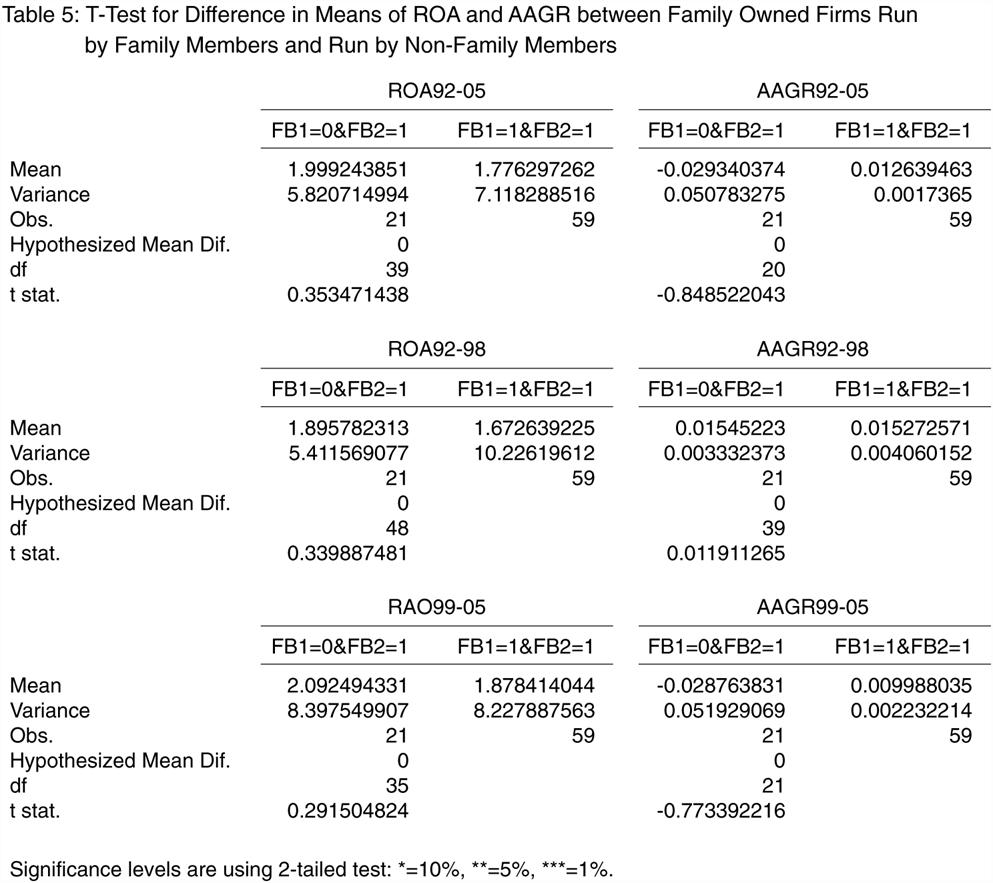
Third, we performed several tests to
examine if combining ownership and control is the reason for better performance
of family firms. One is the t-tests
for difference in means of performance between firms owned by family and run by
family members (FB2=1 and FB1=1) and firms owned by family but run
by non-family members (FB2=1 and FB1=0). The results are shown in Table 5. Any specifications in Table 5 do not
show significant difference. That
is, there is no significant difference in performance between family owned
firms run by the family members and those run by non-family members. Thus, Hypothesis 4 is rejected.
�y189�Łz
�y190�Łz
�y191�Łz
�y192�Łz
�y193�Łz
(2)
Regression Analysis
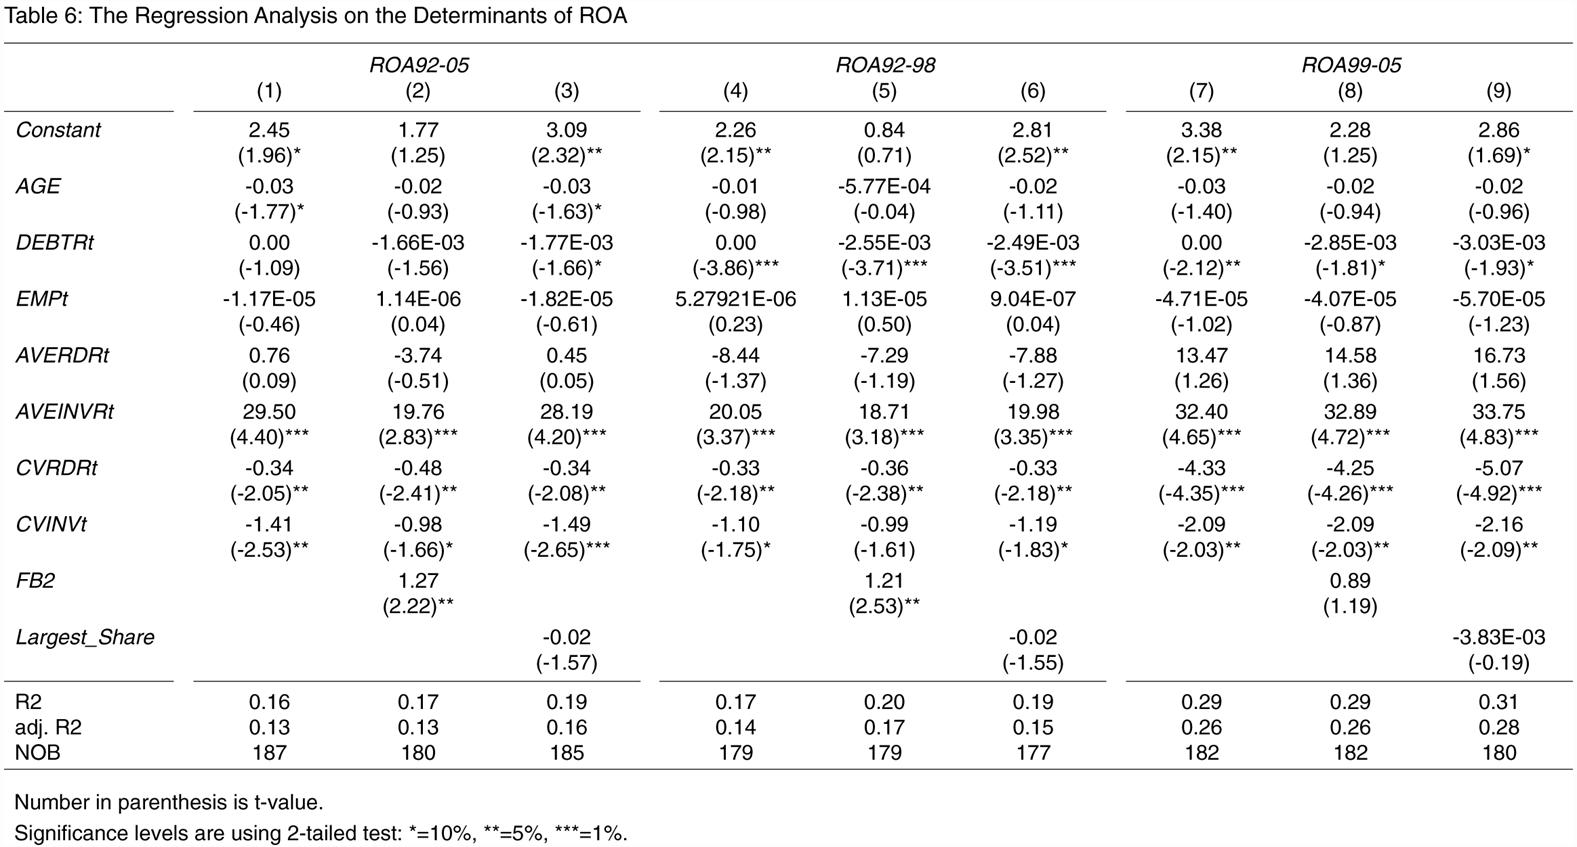
We ran the regressions to examine if
large shareholders' strong incentives to control managers are the reason for
better performance of family firms.
The results are indicated in Table 6 and 7. According to the tables, the
family business dummy (FB2) has
significantly positive relationship with ROA92-05
and with ROA92-98, while does not
have significant relationship with ROA99-05 and with sales growth (AAGRt) during
any periods. Therefore, family
firms show higher ROA from 1992 to 2005 and from 1992 to 1998 than non-family
firms. On the other hand, the
coefficient of Largest_Share in any models is
insignificant in almost all of the models.
In model (9) in Table 7, it is significant but the sign is negative and
opposite to our
expectation. Therefore,
shareholders with large equity share do not have a positive impact on firm
performance, and Hypothesis 5 is
rejected. That is, family firms perform
better because family with large equity share has strong incentives to monitor
managers, while all the large shareholders do not work equivalently. This suggests that not owning large
equity share but family membership does matter.
According to Table 6 and Table 7,
some of the variables indicating investment behavior have significant
coefficients. In all the models of
Table 6, capacity investment (AVEINVR)
has significantly positive coefficients and stability of R&D investment and
that of capacity investment (CVRDRt, CVINVt) have
significantly negative coefficients.
In model (3) through (6) of Table 7, AVEINVRt has a
significantly positive coefficient and CVRDRt has a
significantly negative coefficient.
In model (7) through (9) of Table 7, AVERDRt has a
significantly positive coefficient and CVRDRt has a
significantly negative coefficient.
Therefore, in short, the more the firms invest and the less they change
the amount of investment, the better they perform.
Then, we examined if there is any
difference in investment behavior between family and non-family firms. The results are shown in Table 8, 9, 10,
and 11. Table 8 indicates the
result of the analysis on R&D investment. In model (8), FB2, the dummy for family firms, where family members are listed in
the top 10 shareholders, has significant at the 10% level, but the sign is
negative. In the other models, any
family firm dummies are not significant.
Therefore, family firms do not invest in R&D more than non-family
firms.
In Table 9 indicating the result of
the analysis on capacity investment, on the other hand, FB2 and FB3, dummies for
the firms owned by the family members have significantly positive coefficients
from 1994 to 1998, while they have significantly negative coefficients from
1999 to 2005. Thus, family firms
invest in capacity more than non-family firms from 1994 to 1998, while family
firms invest in capacity less than non-family firms from 1999 to 2005. Hypothesis
6 is supported only in case of capacity investment from 1994 to 1998.
Table 10 shows the results of the
analysis on stability of R&D investment. In models (1) through (6), all the three
kinds of family business dummies have significant coefficients, but the sign is
positive. In Table 11, showing the
results of the analysis on stability of capacity investment, FB3 has a significant coefficient only
in model (4), but the sign is positive.
The positive sign is opposite to our expectation, suggesting that family
firms change the amount of R&D and capacity investment more than non-family
firms. In other models, family
business dummies do not have significant coefficients. Therefore, Hypothesis 7 is rejected.
�y194�Łz
�y195�Łz

�y196�Łz

�y197�Łz
�y198�Łz
�y199�Łz
�y200�Łz
�X�DDiscussion and Conclusion
This paper examined if family firms
perform better than non-family firms and explored what are the advantages of
family firms, using the data on the Japanese electric machinery
manufacturers. We found that family
firms show higher profitability than non-family firms. This is consistent with the existing
empirical analyses in different contexts.
It is often pointed out that
selecting top management from the pool restricted to the family members is the
disadvantage of family firms. We
found that family firms run by successors from the family members perform worse
than those run by the founders. But
we did not find any significant difference in performance between family firms
run by the successors and those run by non-family managers. Therefore, whether managers are
appointed from the restricted pool or not does not matter. This suggests that better performance of
the founders may be caused by the youth of the firms, and that restricted pool
of managers is not the important disadvantage of family firms.
It is also argued that combining
ownership and control mitigates agency conflicts and is the advantage of family
firms. However, we found no
significant difference in performance between firms own by and run by family
members and those owned by family but run by non-family members. This suggests that combining ownership
and control is not the advantage of family firms. Similarly, it is often pointed out that
founding family with large equity share has strong incentives to monitor managers, therefore, family firms
perform better. However, we found
no significantly positive impact of the equity share of the largest
shareholders on performance.
That is, large equity share by itself does not strengthen monitoring
managers.
Other studies pointed out that longer
investment horizons of the family are the advantage of family firms. We found family firms invest in capacity
significantly more than non-family firms from 1994 to 1998, while we did not
find the evidence supporting the hypothesis during other periods or in terms of
R&D investment. We did not also
find the evidence supporting the hypothesis in terms of stability of
investment. However, R&D
investment does not have significantly positive impacts on performance in the
regression analyses reported in Table 6 and Table 7. That is, R&D investment is not a
significant determinant of firm performance in our data, therefore, it is not
strange to find insignificant results for R&D investment.
Moreover, taking it into account that
Japanese economy did not grow in the 1990s while it has recovered in 2000s, the
findings above can be interpreted in the following way. When economy is growing, firms invest in
capacity whether they have long horizon or not. Therefore, we did not find a significant
difference in investment behavior between family and non-family firms.
When economy is stagnant, on the
other hand, firms invest differently depending upon horizon they have. Firms, which are concerned with
short-term performance, should decrease capacity investment to recover
profitability. On the other hand,
firms with long horizon may be patient enough to invest a lot in capacity in
spite of low profitability. If so,
family firms may invest in capacity aggressively even when economy is stagnant
since they have long horizon, and because of such investment behavior, they may
perform better. In sum, family
firms have advantage of long horizon, which makes the behavior of family firms
different from that of non-family firms especially during low growth period.
�y201�ŁzThere are several future
research agenda. First, in this
study, we defined family firms in terms of management and in terms of
ownership. In terms of management,
the criterion is whether the president or the chairman of the firm is from the
founding family. However, not only
the president or the chairman is influential, but also the family members in
the board, could influence on firms performance. Therefore, we need to examine family
firms in more detail. Second, this
is a single industry study. We will
collect the data of other industries and see if there is any difference among
industries and if we can generalize our findings. Third, we examined only R&D and
capacity investment and stability of them as investment behavior. However, to examine the effect of long
horizon, we need to examine other investment such as diversification, global
expansion, and so on.
References
Berle, A. and Means, G., 1932, The Modern Corporation and Private
Property,
Casson, M., 1999, �gThe Economics of
the Family Firm,�h Scandinavian Economic
History Review, 47: 10-23.
Demsetz, H., 1983, �gThe Structure of
Ownership and the Theory of the Firm,�h Journal
of Law and Economics, 25: 375-390.
Demsetz, H. and Lehn, K., 1985, �gThe
Structure of Corporate Ownership: Causes and Consequences,�h Journal of Political Economy, 93:
1155-1177.
Fama, E. and Jensen, M., 1983,
�gSeparation of Ownership and Control,�h Journal
of Law and Economics, 26: 301-325.
James, H., 1999, �gOwner as Manager,
Extended Horizons and the Family Firm,�h International Journal of the Economics
of Business, 6: 41-56.
McConaughy, D. L., Matthews, C. H.,
and Fialko, A. S., 2001, �gFounding
Family Controlled Firms: Performance, Risk, and Value,�h Journal of Small Business Management, 39: 31-49.
Schleifer, A. and Summers, L., 1988, �gBreach of
Trust in Hostile Takeovers,�h in A. Auerbach, ed., Corporate Takeovers: Causes and Consequences,
Shleifer, A. and Vishny, R., 1997, �gA Survey of
Corporate Governance,�h Journal of Finance,
52, 737-783.
Stein, J., 1988, �gTakeover Threats
and Managerial Myopia,�h Journal of
Political Economy, 96: 61-80.
Stein, J., 1989, �gEfficient Capital
Markets, Inefficient Firms: A Model of Myopic Corporate Behavior,�h Quarterly Journal of Economics, 103:
655-669.